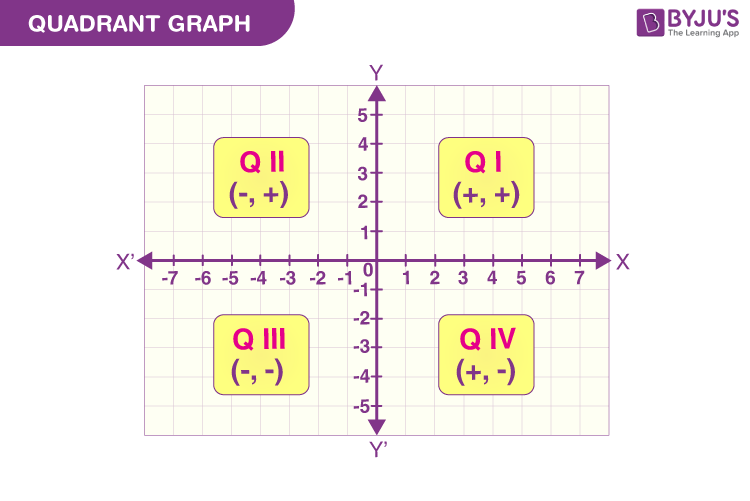
I know what you’re thinking: “Cool story, friend. But when will I ever need to know this?” First of all, rude. But second, it shows up everywhere.
Think about temperature. Imagine the x-axis is time (like hours before noon) and the y-axis is temperature. Before noon? That’s negative x. But it’s warm? That’s positive y. Boom. You’re in Quadrant 2. You’re experiencing a warm morning before the sun hits its peak.
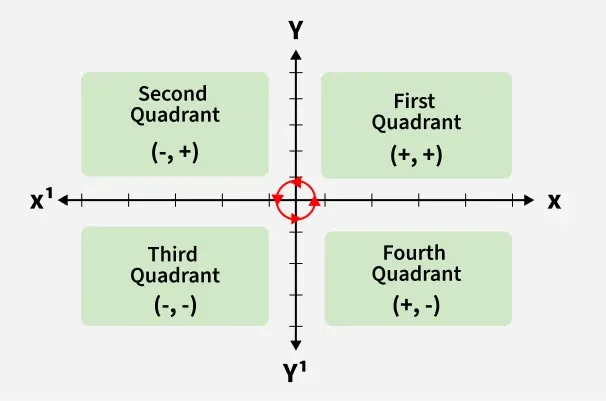 Quadrant Ii
Or, think about money and speed. What if you’re moving backwards (negative x direction) but your bank account is going up? That’s a weird, confusing life. But mathematically, you’re chilling in Quadrant 2. It’s the quadrant for paradoxical progress.
Heck, even video games use it. When you’re running left on the screen but jumping up, your character’s coordinates are literally in Quadrant 2. You’re a pixelated hero in the land of negative x.
The Plotting Ritual: How to Visit Quadrant 2
Let’s do a quick drill. Don’t worry, no calculator required. Imagine someone hands you a point: (-4, 3).
First, you look at the x. It’s negative four. So you move your finger left from the center. Count one, two, three, four. Don’t go up yet!
Now look at the y. It’s positive three. From that left spot, move up. One, two, three. Stop right there. Look around. You are now officially a tourist in Quadrant 2.
That little dot you placed is telling a story. It’s saying, “I am four steps to the left of center, but three steps above the baseline.” It’s a specific, sassy little location.
 Quadrant Chart Graph