Tables aren’t just for accountants or data nerds. You use them every single day without even realizing it. Ever sort your pantry by expiration date? That’s a table instinct. Ever compare prices at two different grocery stores? That’s a table waiting to happen.
When you create a table in Excel, you unlock a magical superpower: your data starts to think for itself. Add a new row, and the formatting snaps into place. Filter out everything except your favorite items, and the rest vanishes. It feels less like work and more like sorcery.
I still remember the first time I used a table to track my plant watering schedule. Before, I’d just scribble notes on sticky notes that fell behind the fridge. Now, I can instantly see which plants need love, which are overwatered, and whether my fern is just being dramatic again.
Your First Table: A Five-Second Miracle
Open Excel and type in some simple stuff. Let’s pretend you’re tracking your weekend errands. In column A, write “Task.” In column B, write “Day.” In column C, write “Done?” Add a few silly entries like “Buy milk,” “Saturday,” “No.”
Now here’s the trick: click anywhere inside your messy little list. Head to the top menu bar and look for the “Insert” tab. Then, find the big button that says “Table.” Click it. That’s it. Really.
Excel will ask if your table has headers. Say “Yes” to that checkbox. Suddenly, your plain text now has blue and white stripes, little dropdown arrows at the top, and a fancy new name like “Table1.” You didn’t do any heavy lifting—Excel bent the universe for you.
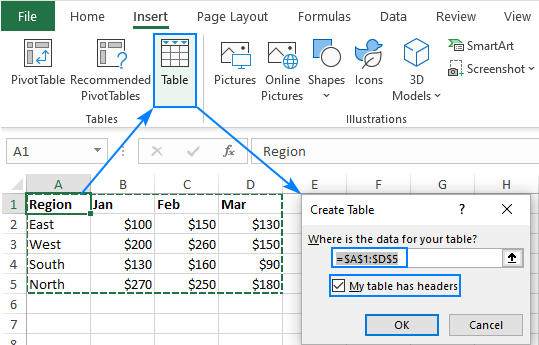 How to Create a Simple Table in Excel: Step-by-Step Guide